

A locksmith in Los Angeles has 568 reviews and a perfect five-star rating. When the owner searches "locksmith service in los angeles" from the shop, Google Maps shows the business third. That looks like a strong result, and on that street it is. About three miles north, the same search shows the business 16th. Across the whole city, it is in the top 3 at only 5 of the 49 spots we checked.
That gap between one rank check and the real picture is what local SEO rank tracking is for. This guide explains how to track your Google Maps rankings properly: how a grid scan works, how to read the heatmap it produces, which numbers matter, how to set one up, and how to tell a real change from the normal day-to-day wobble.
We build the Google Maps rank tracker used for every scan here, so we had a lot of real data to test our advice on. Every number in this guide comes from 279 real grid scans of 53 local businesses and 48 keywords, made between July and November 2026, plus three new scans run minutes apart for one test. Business names are hidden; everything else is exactly as Google returned it.
64%
of scans had the business in the top 3 at its own address
49%
of those were top 3 at fewer than half of the points around them
10
different businesses hold a top 3 spot somewhere on a typical grid
9 in 10
week-on-week changes in average rank were under one place
What is local SEO rank tracking?
Local SEO rank tracking is measuring where your business appears on Google Maps for the searches customers make, from many places across your area and over time, so you can see where people can find you and whether your work is moving that.
It is different from normal rank tracking for websites. A website's position for a keyword is roughly the same across a city. A map ranking is not. Google ranks local businesses partly on how close they are to the person searching, so your rank changes from street to street. A local rank tracker deals with that by searching from many spots at once and drawing the result as a map, which is why people also call it a heatmap or a geo-grid.
Why one rank check misleads you
Most owners check their ranking by searching on their own phone. The trouble is where they are standing. Your phone searches from your location, and you are usually at or near your business, which is the spot where you rank best.
We measured how big that effect is. In 64% of the scans, the business was in the top 3 at its own address. For half of those, it was in the top 3 at fewer than half of the points around it. The typical gap between the rank at the door and the average across the area was 2.3 places, which on a map pack of three can be the difference between being seen and being scrolled past.
What this means in practice
If you check your rank from the office, you will usually see a number better than most of your customers see. The ones searching a few miles away, where most of your jobs or visits come from, often get a different list.
Two more things make a single check unreliable. Google personalises results for people who are signed in, so your own phone may favour places you have visited, including your own business. And results move a little from day to day, so one check on one day can catch a good or a bad moment. A grid scan from a neutral, signed-out search, repeated on a schedule, fixes both.
How a grid scan works
A grid scan places a pattern of points over your area, for example 7 rows of 7 points, one mile apart, with your business in the middle. For each point, the tracker runs the same Google Maps search as if a person were standing there, and records the top 20 businesses Google shows. It then marks your position at that point.
- 1
The grid is laid out around a centre point
Usually your address. For a business that hides its address and drives to customers, it is the middle of the area you serve. - 2
Each point is a separate search
The same keyword, searched on Google Maps from those exact coordinates, signed out, at the same map zoom for every point. 49 points means 49 searches. - 3
The top 20 is recorded at every point
Not just your position, but every business above and below you, with its rating and review count. That is what lets you see who beats you where. - 4
Each point gets a colour
Dark green for the top 3, light green for 4th and 5th, yellow for 6th to 15th, red for 16th to 20th, and dark grey with "20+" when you are not in the top 20 at all.
Google lists three things it uses to rank local results on its own help page: relevance, distance and prominence. A grid scan largely holds relevance and prominence steady, because it is the same keyword and the same business at every point, and changes only the distance. That is why it shows so clearly how far your strength reaches.
How to read a Google Maps heatmap
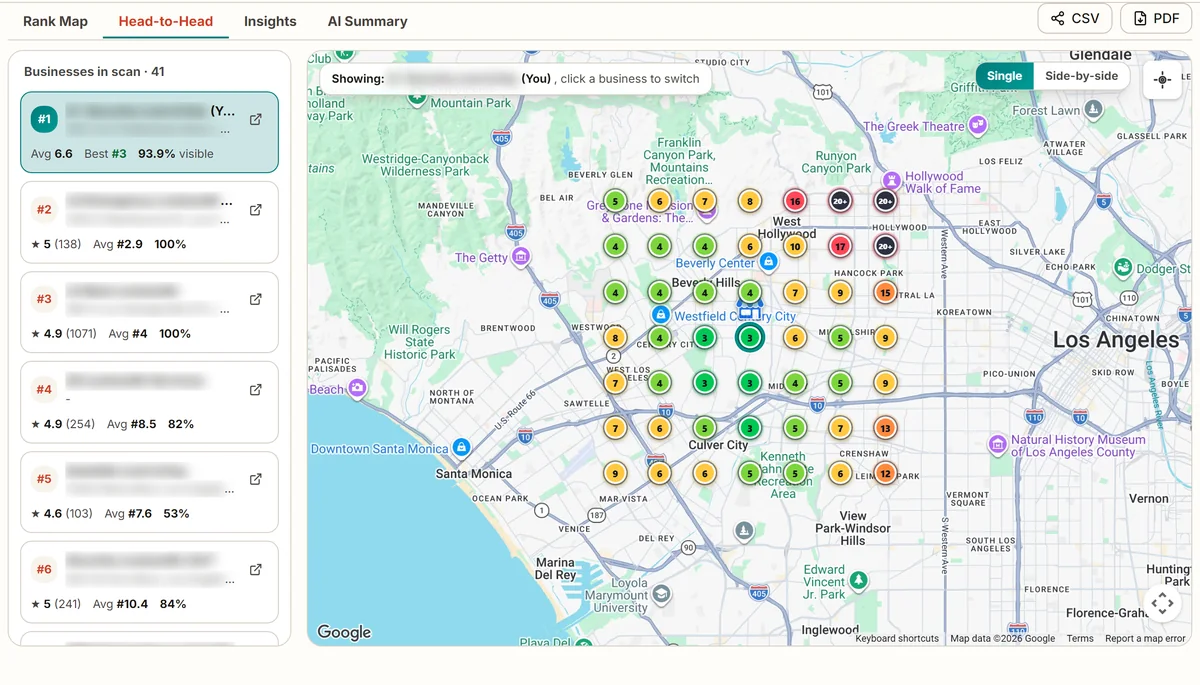
Here is the locksmith's scan from the introduction, exactly as the report shows it. It is a 7 by 7 grid with points one mile apart, so it covers an area 6 miles across. The keyword is "locksmith service in los angeles" and the scan ran on November 3, 2026.
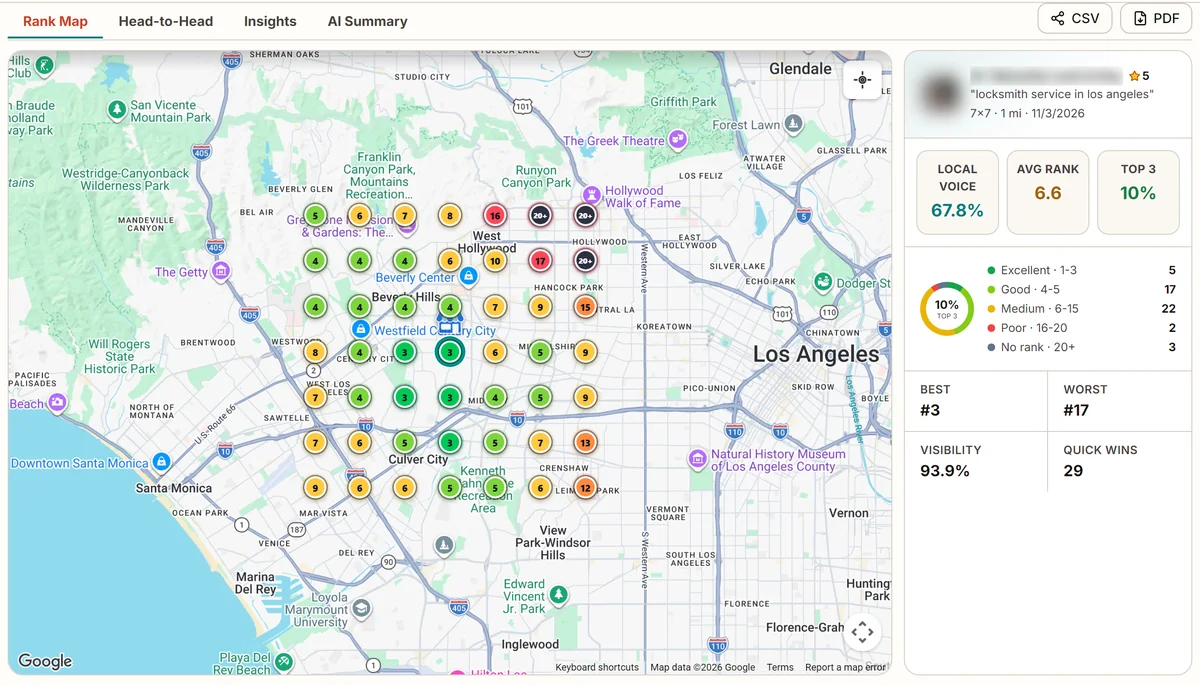
Read it in this order:
- 1
Find the ringed point
That is the business. Here it ranks 3rd, which is what the owner sees from the shop. - 2
Look for where the colour changes
Green runs west and south-west for about two miles. To the east it turns yellow (6 to 10). In the north-east corner it turns red (15 to 17) and then grey (20+): not in the top 20 at all. - 3
Look for a direction, not single points
One odd point can be noise. A whole corner of one colour is a pattern, and patterns have causes. Here the weak side is the north-east, towards Hollywood. - 4
Check the summary on the right
Local voice 67.8% (one score for how much of the map it owns), average rank 6.6 where it appears, top 3 at 10% of points, visible in the top 20 at 93.9% of points, and 29 "quick wins": points where it ranks 4th to 7th.
Click a point to see who beats you there
The colour tells you where your rankings are weak. Clicking a point tells you why, because it opens the full top 20 from that spot. This is the red 16 near the top of the grid, about three miles north of the shop.
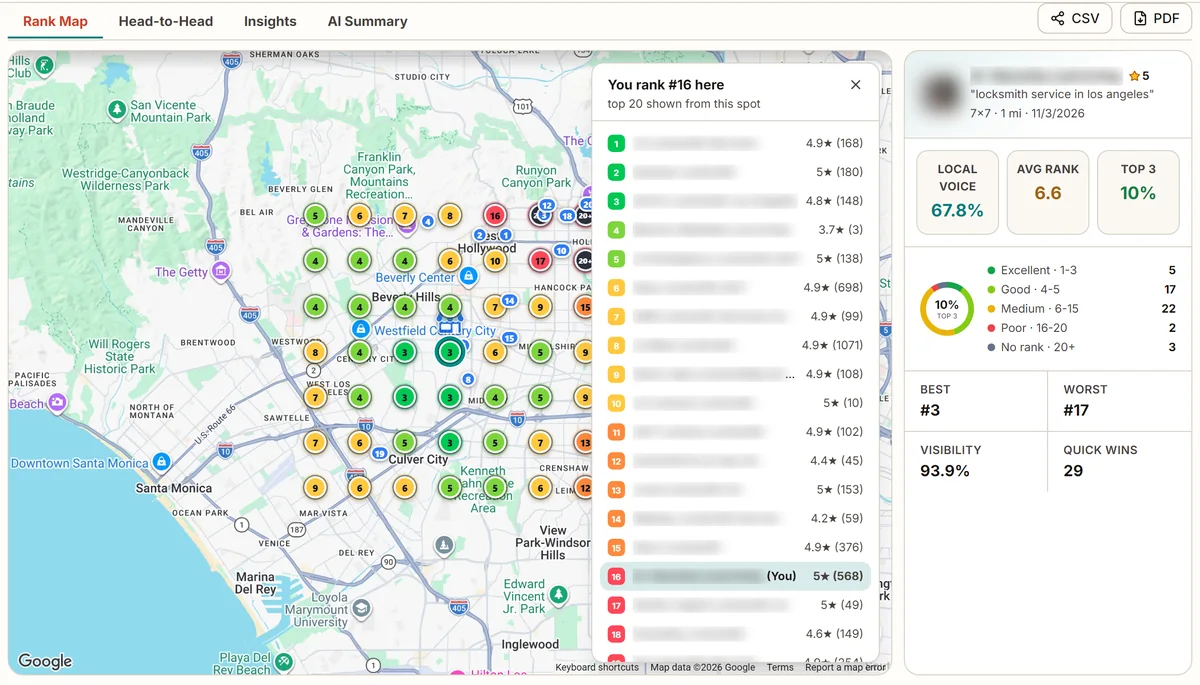
The businesses above it at that spot are not all bigger. One in the top 5 has a 3.7 rating from three reviews. What they have in common is that they are closer to that corner of the city. That is a distance problem, and the fixes for it are different from the fixes for a reviews problem, which we cover in the map patterns section below.
The numbers on a rank tracking report, explained
Every tracker turns the map into a few numbers so you can compare scans. They are useful, but they are easy to misread because each one answers a different question, and tools use the same names for different calculations. Here are all of them from the same locksmith scan.
| Number | This scan | What it answers |
|---|---|---|
| Rank at the business | #3 | Where you rank on your own street. The number the owner sees. |
| Average rank where you appear | 6.6 | How strong you are at the points where you show up at all. Flatters a business that is missing from much of the map. |
| Average rank across all points | 7.4 | The same, but counting every point where you are not in the top 20 as 21. The honest area-wide figure. |
| Top 3 share | 10% (5 of 49) | What share of the grid points see you in the map pack. The closest number to calls. |
| Visibility | 93.9% (46 of 49) | Points where you are anywhere in the top 20. |
| Local voice | 67.8% | One score for how much of the map you own, weighting each point by rank. |
| Quick wins | 29 points | Points where you rank 4th to 7th, one push from the top 3. |
Locksmith, Los Angeles, 7 by 7 grid at 1 mile, November 3, 2026.
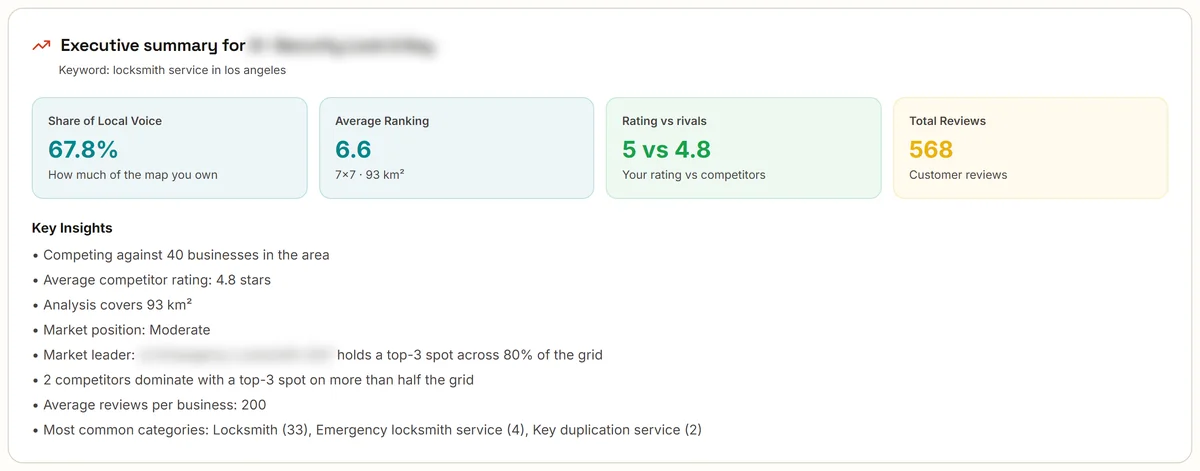
Two of these deserve a warning. First, average rank comes in two versions. Averaging only the points where you appear gives 6.6 here. Counting the misses as 21 gives 7.4. On a business that is missing from half its map, the gap between the two can be ten places, so check which one you are looking at before you celebrate.
Second, "share of local voice" means different things in different tools. Some count the share of points where you are in the top 3, which here would be 10%. Our report weights every point by your position: first place counts fully, 20th place counts 5% and not ranking counts nothing. That gives 67.8% for the same map. Neither is wrong, but you cannot compare one tool's score with another's.
If you only watch one number, watch the top 3 share. The map pack in normal Google search shows three businesses, and the businesses in it get most of the calls. A move from 5 to 15 points in the top 3 changes your phone; a move in average rank from 7.4 to 7.1 usually does not.
How your rank fades with distance
Every map in our data had the same basic shape: strong near the business, weaker with every mile. Here is how much, across 13,351 points from all 279 scans.
The further from the business, the fewer top 3 spots
At the business itself, our businesses were in the top 3 at 64% of scans. One mile out, that fell to 45%. At four miles, 34%. The share of points where the business was missing from the top 20 entirely grew from 2% at the door to 16% at four miles. Beyond four and a half miles, on the bigger 9 by 9 grids, not one point was in the top 3.
This is the single most useful thing a heatmap tells you, because it maps directly to money. If most of your customers live within two miles, you can live with the shape. If you are a plumber or a roofer who drives 10 miles for a job, the grey edge of your map is where many of your missed calls are likely to be.
Who you are really competing against
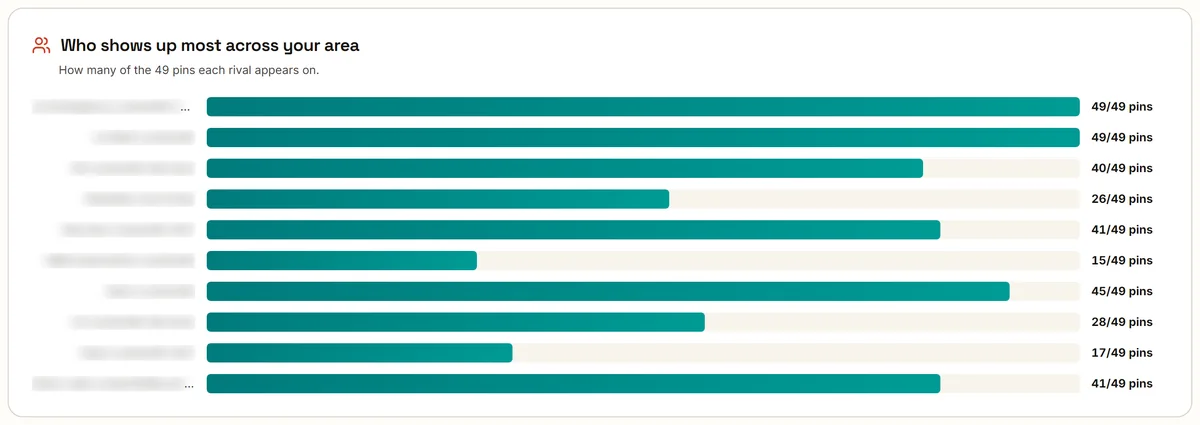
The map pack shows three businesses, so it is easy to think you have three rivals. Across our 236 scans at 7 by 7, a median of about 50 different businesses appeared in the top 20 somewhere on the grid, and 10 different businesses held a top 3 spot at one point or another. The three you see on your own phone are just the three closest to you.
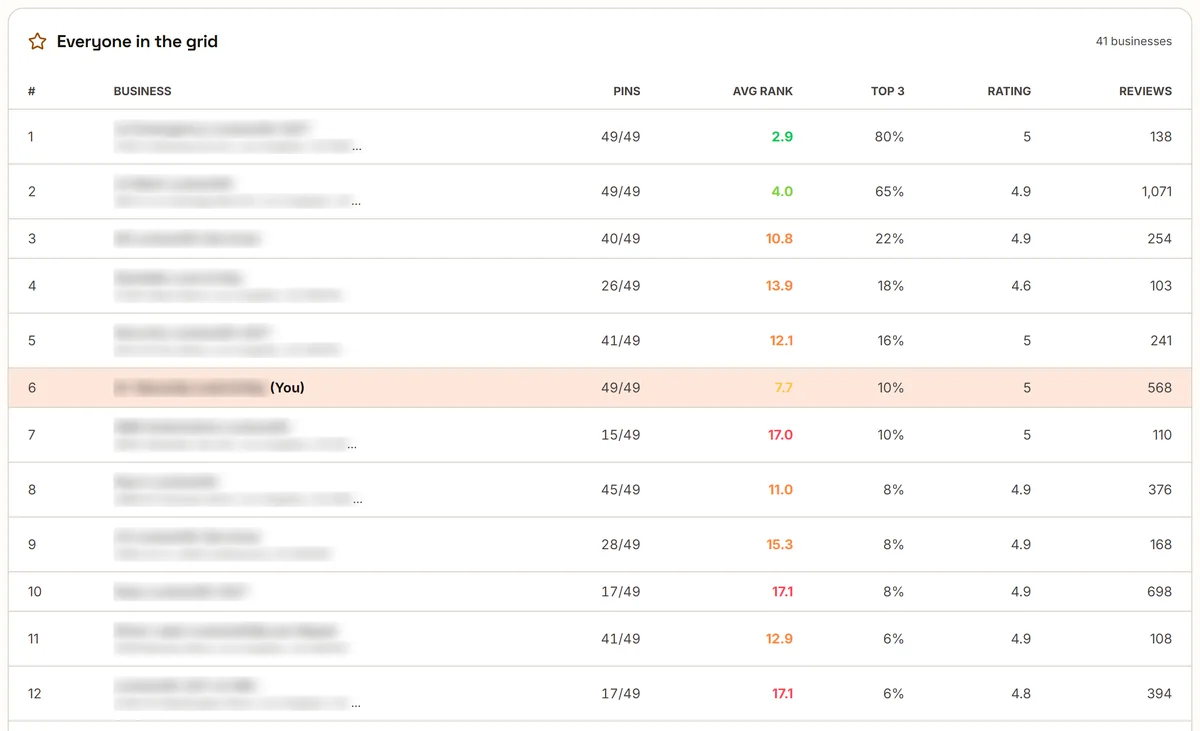
The full list is where the surprises are. In the locksmith scan, the business that holds the top 3 across 80% of the area has 138 reviews. Our locksmith has 568 and holds 10%. A third locksmith with 1,102 reviews appears at just one point of 49, most likely because its office sits at the very edge of the grid. Reviews matter, but they do not beat distance on their own.
How to set up your first rank tracking scan
A scan is only as useful as its settings, and you want to pick them once and keep them, so later scans can be compared. Here is how we set one up.
- 1
Pick three to five keywords the way customers type them
Start with your main service as people say it: "emergency plumber", "dentist", "locksmith". Add the city if people in your market add it, and track a "near me" version too, because the scan searches from each point and "near me" behaves like a real nearby search. Add one or two money services, such as "dental implants" or "roof replacement". Each keyword is its own map. - 2
Find your business by name or Google Maps link
If your business hides its address because you go to customers, paste its Google Maps link so the scan finds the exact listing. You do not need to connect your Google account, so you can scan a competitor the same way. - 3
Set the centre point
Use your address for a shop or office. For a business that serves customers at their place, use your base, or the middle of the area you want to win if your base sits at one edge of it. - 4
Choose a grid size and spacing
Match the grid to where your customers are, not to the biggest area the tool allows. The width of the grid is the points per side minus one, times the spacing: 7 by 7 at 1 mile covers 6 miles across. The next section shows how much your spacing choice changes the result. - 5
Run the scan and read it
Look at the map first, then the top 3 share, then click two or three of the worst points to see who ranks there. Write down the pattern you see. - 6
Save it as a schedule with the same settings
Weekly or monthly, same keyword, same centre, same size, same spacing, same time of day. A scan with different settings is a new baseline, not a comparison.
| Type of business | Grid | Spacing | Area covered |
|---|---|---|---|
| Walk-in shop in a dense city (cafe, salon, city dentist) | 7 by 7 | 0.5 mile | 3 miles across |
| Shop or office in a suburb (dentist, gym, lawyer, vet) | 7 by 7 | 1 mile | 6 miles across |
| Service business across a metro area (plumber, locksmith, pest control, roofer) | 7 by 7 or 9 by 9 | 1 to 1.5 miles | 6 to 12 miles across |
| Rural or regional business | 5 by 5 or 7 by 7 | 2 to 3 miles | 8 to 18 miles across |
Starting points. If most of your customers come from a smaller or bigger area, change the spacing to match it.
Two more tips. If part of the grid falls over a lake, the sea or a forest, remove those points in the point editor before you save the schedule, because nobody searches from there and they drag your averages down. And scan at the same time of day each time, ideally while you are open, because results can shift between morning and night.
Grid size and spacing: the same business, three answers
The spacing you choose changes the result more than any other setting. To show how much, we scanned the locksmith three times late on November 5, 2026, minutes apart. Same keyword, same centre, same 49 points. Only the distance between the points changed.
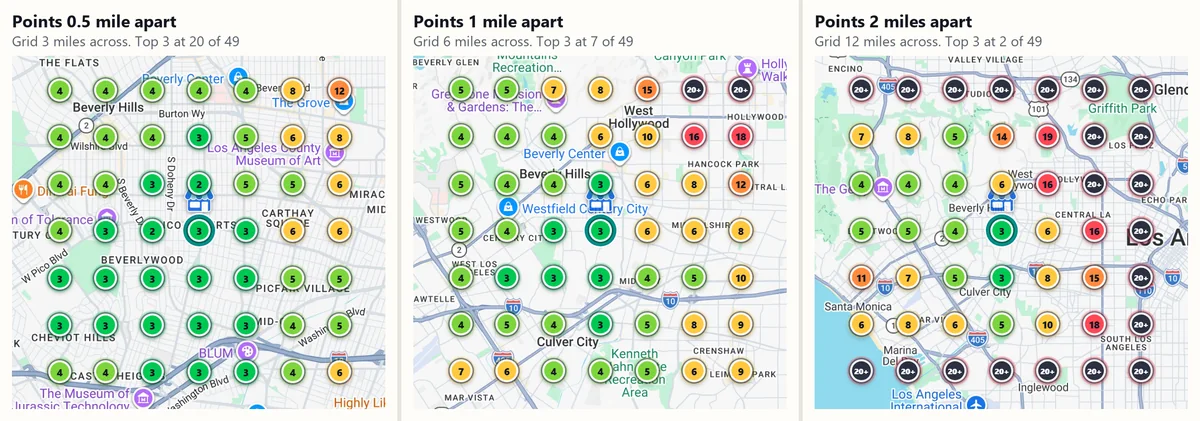
| Spacing | Grid covers | Top 3 | Top 10 | Not in top 20 | Average rank, all points |
|---|---|---|---|---|---|
| 0.5 mile | 3 miles across | 20 of 49 | 48 of 49 | 0 | 4.2 |
| 1 mile | 6 miles across | 7 of 49 | 43 of 49 | 2 | 6.8 |
| 2 miles | 12 miles across | 2 of 49 | 21 of 49 | 21 | 13.7 |
Locksmith, Los Angeles, 7 by 7, three scans minutes apart on November 5, 2026. Average rank counts points outside the top 20 as 21.
All three scans are true. The tight grid says "you own your neighbourhood". The wide one says "you are invisible across most of the city". If you only ever run the tight one, you will think you are winning; if a tool or an agency runs the wide one, the same business looks like a disaster. That is why the right spacing is the one that matches where your customers are, and why it has to stay the same from scan to scan.
How to tell a real rank change from noise
Google Maps results are not frozen. They move a little every day, and they sometimes shift for everyone at once. Before you react to a scan, it helps to know how much movement is normal. We measured it.
Same grid, scanned twice within 48 hours
- Points that changed rank
- 4%
- Points that moved 3 places or more
- 0.1%
- Typical change in average rank
- 0.02
10 pairs of scans, 714 points compared.
Same grid, one week apart
- Points that changed rank
- 25%
- Points that moved 3 places or more
- 4%
- Typical change in average rank
- 0.12
- Weeks where the average moved 1 place or more
- under 1 in 10
181 pairs of weekly scans, 8,841 points compared.
Within 48 hours, very little moves: 4% of points change, and almost none by more than two places. Over a week, a quarter of points change, but mostly by one or two places, and the average across the whole grid typically moves by about a tenth of a place. In fewer than one week in ten did a business's average rank move by a full place or more.
Then there are the days when Google itself shifts. On October 13, 2026, 13 of the 21 grids we scan every week had a worse average rank on the same day. Eight of them were back to normal the following week. Five stayed down. Here are three real businesses from those weekly scans, showing the three shapes you will meet.
Three real businesses, scanned every week with the same settings
The pest control company in green moved up in its first two weeks and then held the new level for two months. That is a real change. The flooring contractor in amber fell sharply on October 13 and was back within a week: that was noise, and acting on it would have been a waste. The concrete contractor in red fell on the same day and stayed down for the next three weeks: that one was real, and worth investigating.
Our rule for acting on a rank change
Do not act on one scan. Act when two scans in a row, with the same settings, agree. If many of your keywords or many businesses drop on the same day, it is almost always Google, not you, so wait a week before you change anything.
What ten weeks of tracking looks like
The green line above is a pest control company in Texas that we build links for. We scanned "Pest Control in San Marcos tx" weekly from August 27, 2026, on a 7 by 7 grid with points one mile apart. Between the first scan and September 8, 24 new links to the business went live, 12 from city blogs and 12 from niche blogs, and its reviews went from 9 to 12 over the period.
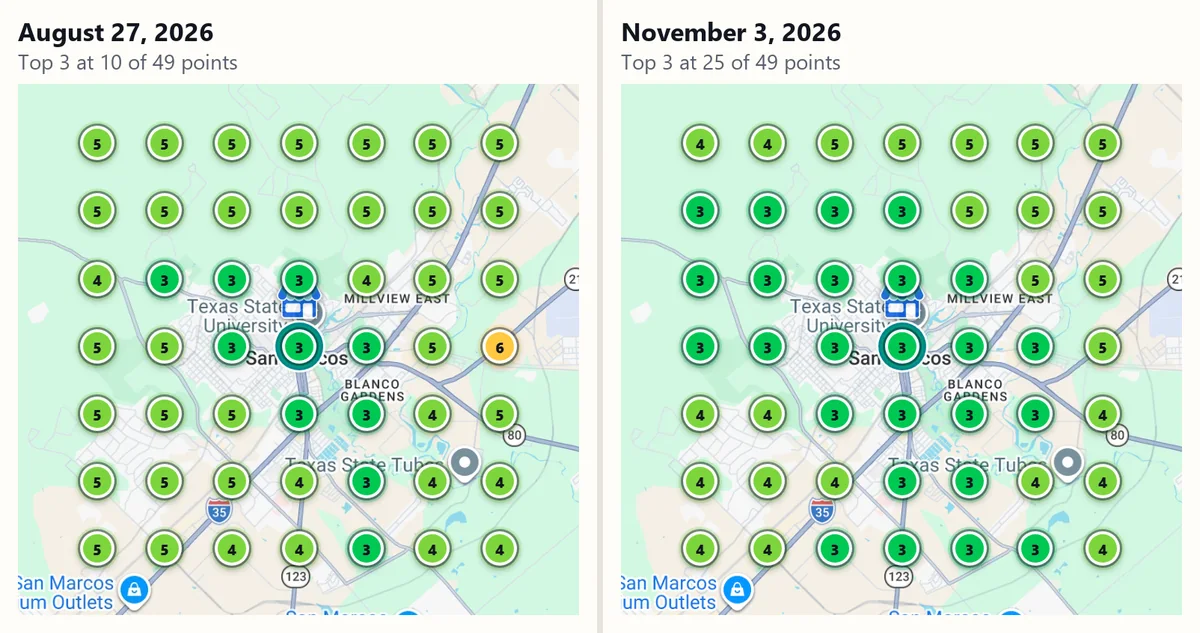
Top 3 points went from 10 to 15 in the first week, to 26 the week after, and then stayed between 23 and 26 for eight weeks. We cannot prove which change did it, because several happened at once. What we can say is that this is what a real improvement looks like on a tracker: a step up, and then a new level that holds, not a single good week.
Six heatmap patterns and what to fix for each
Once you have read a few maps, the same shapes keep coming back. Each one points at a different cause, which is the real value of tracking: it tells you what to work on.
| What the map shows | What it usually means | What to do first |
|---|---|---|
| Green at the centre, fading to red at the edges | Normal distance decay. Strong locally, not prominent enough to reach further. | More reviews, links from sites about the outer areas, a page for each area you serve. |
| Red or grey in one direction only | A cluster of competitors on that side, or a part of town Google does not link to you. | Click those points, see who wins there, and build a page and links for that area. |
| Weak even at your own address | A relevance problem: wrong main category, thin profile, or a keyword your profile does not match. | Check the primary category and services, then audit the profile. |
| Grey everywhere, even at your door | The listing is filtered, suspended, unverified or matched to the wrong keyword. | Check the profile is live and verified, then check the keyword you are tracking. |
| Strong for one keyword, weak for another | Google does not connect you with that service. | A service on your profile and a page on your site for that service. |
| A sudden drop that comes back | Normal movement or a Google-wide change. | Nothing. Check the next scan before acting. |
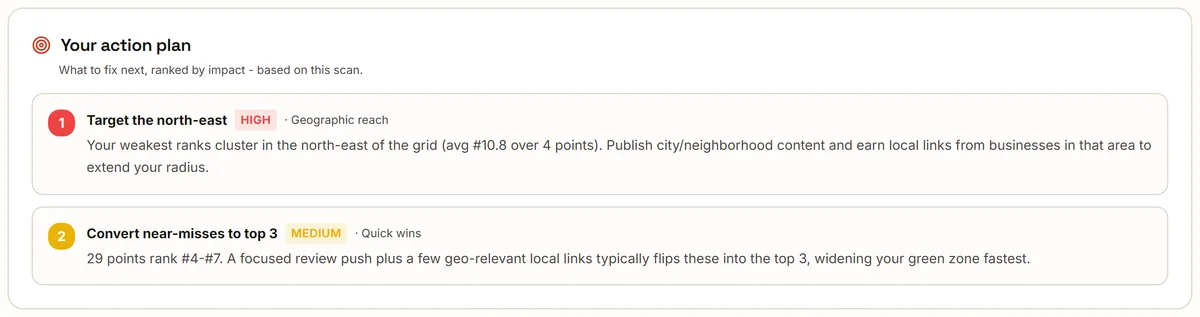
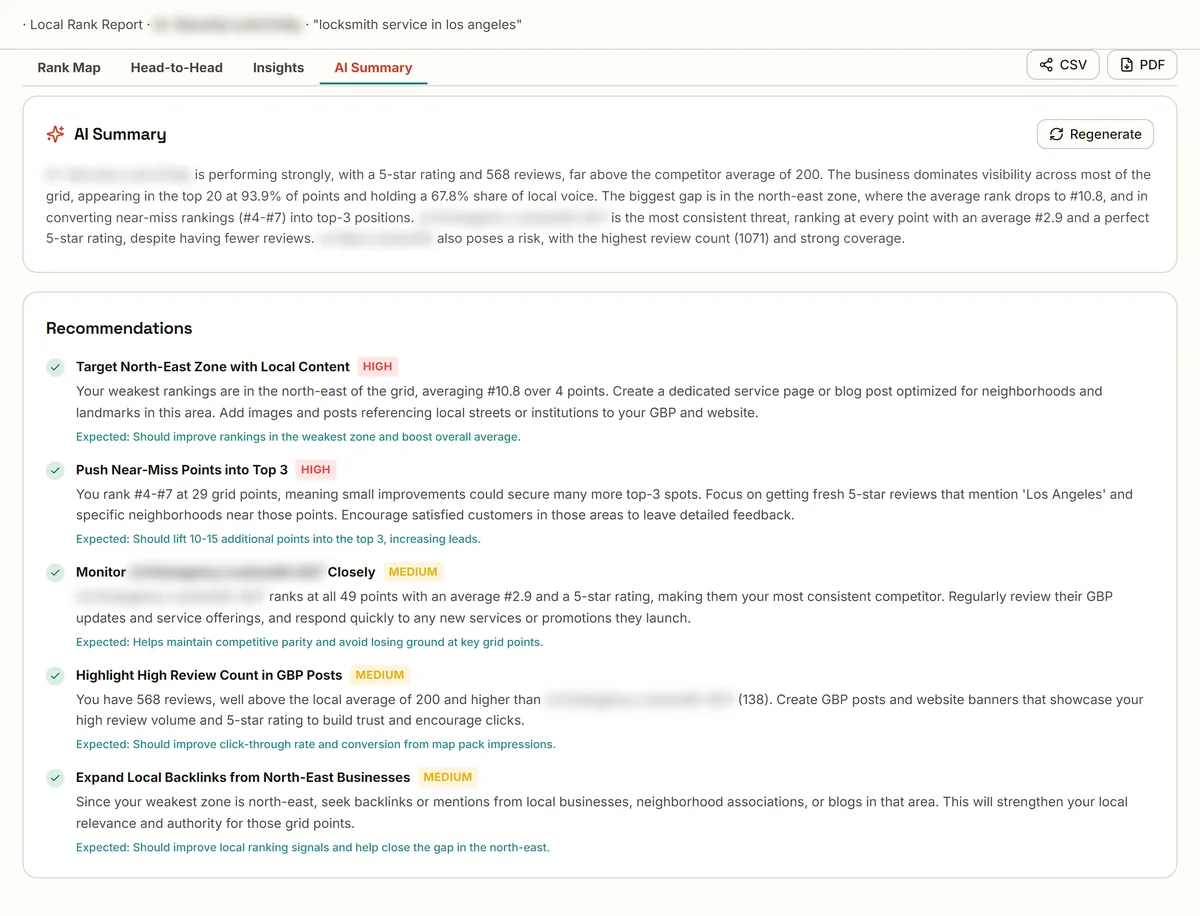
The report does the first pass for you. The Insights tab lists an action plan ranked by impact, and the AI Summary tab writes the same findings out in plain sentences, naming the weakest zone and the rivals to watch.
If your map is grey everywhere, read why a business is not showing on Google Maps, which goes through the 12 causes one by one, and our 21-point local SEO audit.
Scheduled scans and rank change alerts
Tracking only works if it happens without you remembering to do it. Set each keyword up as a schedule, and the scans run on their own with the same settings every time.
- Weekly for your main keywords. It is enough to see any change that lasts, and it smooths over day-to-day wobble.
- Daily for one or two keywords that bring in the most work, when you want to know about a problem within a day.
- Monthly for the long tail of service keywords, and for any business that is already stable.
Each scheduled scan emails you the new map when it finishes. You can also switch on an alert when map visibility drops by a set amount, from 10% to 50%, compared with the previous scan that used the same settings. It goes to email, and to Slack if you connect it. Google does not notify business owners when their rankings change, so every tracker has to check on a schedule. A daily alert is about as fast as any tool can honestly promise.
Choosing a tracking tool: 8 things to check
Most trackers draw a similar map. The differences are in what they let you do with it. Before you pay for one, check these points.
| Check | Why it matters |
|---|---|
| Grid sizes and spacing you can set | You need to match the grid to your real service area, from half a mile to several miles apart. |
| The full top 20 at every point | Without it you see where you are weak but not who beats you there. |
| Scans of any business, without connecting Google | So you can scan competitors, prospects and businesses that hide their address. |
| Schedules that keep the same settings | Comparisons are only fair when everything but the date is the same. |
| Both kinds of average rank, and a top 3 share | So a business missing from half its map cannot look healthy. |
| Alerts when visibility drops | So you hear about a problem from the tracker, not from a quiet phone. |
| Shareable reports, PDF and CSV | Clients and managers want to see the map, not a number in an email. |
| Clear cost per point | A 7 by 7 grid is 49 searches per keyword. Know what a month of your schedules costs. |
Our Google Maps rank tracker includes everything on this list. You can run a 25-point scan for any business on the tracker page with no account, and a free account adds 250 Grid Credits, about five scans at 7 by 7. One point costs one credit.
Local rank tracking checklist
Copy this into your notes.
Set up once
Three to five keywords, written the way customers search, plus one "near me" version
Centre on your address, or the middle of the area you serve
A grid that covers where your customers are: 7 by 7 at 0.5, 1 or 1.5 miles
Points over water or empty land removed
Every scan
Read the map first: where does green stop and in which direction is it weak?
Note the top 3 share, then the average rank across all points
Click the two or three worst points and write down who wins there
Every month
Compare only scans with the same keyword, centre, size, spacing and time of day
Act on a change only when two scans in a row agree
Pick one pattern from the map and fix its cause: reviews, an area page, links or the profile
See your own heatmap in a minute
Scan your main keyword across your area and see where the green stops. No account and no card for the first scan.
Questions people ask about local rank tracking
What is a local SEO heatmap?
A local SEO heatmap is a map of your Google Maps rankings across an area rather than at a single spot. A tool searches your keyword from a grid of points, for example 49 points one mile apart, and colours each point by where your business ranked there: green in the top 5, yellow from 6th to 15th, red from 16th to 20th and dark grey when you are not in the top 20 at all. It shows where customers can find you and where they cannot.
Why is my business green near my office and red further away?
Because distance is one of the three things Google uses to rank local results, along with relevance and prominence. Close to your address, distance works in your favour. A few miles out, businesses that are closer to the searcher take your place unless you are much stronger than them. In 279 scans we measured, businesses were in the top 3 at 64% of their own addresses but at only 34% of points about four miles away. More reviews, a page for each service and area you cover, and links from sites about those areas are what push the green further out.
What grid size should I use for local rank tracking?
Size the grid to the area your customers come from. A 7 by 7 grid is the usual choice. Use points half a mile apart for a shop in a dense city, one mile apart for a business in a suburb, and one to two miles apart for a service business that drives to customers across a metro area. The width of the grid is the number of points per side minus one, times the spacing, so 7 by 7 at one mile covers 6 miles across. Keep the same size and spacing every time so scans can be compared.
What is share of local voice?
Share of local voice is a single score for how much of the map you own. Tools define it differently. Some count the share of grid points where you are in the top 3. Our report weights every point by your rank: first place counts fully, 20th place counts a little and not ranking counts nothing, so 100% means first everywhere. On the same Los Angeles scan in this guide, the top 3 share was 10% and the weighted score was 67.8%, so always check which definition a report uses.
How often should I check my local rankings?
Weekly is enough for most businesses, and monthly is fine when nothing is changing. Scan weekly for a month or two after a big change such as new pages, a burst of reviews or a link campaign. Daily scans are useful for alerts on keywords that bring in the most work, but do not act on one bad day: in our data, 13 of 21 tracked grids got worse on the same day in October and 8 of them were back within a week.
How accurate is a Google Maps rank heatmap?
Each point is a real Google Maps search made from that spot, signed out, so it is an accurate snapshot of what an average person there would see at that time. Real customers can see slightly different results because Google personalises for people who are signed in. Results also move a little from day to day. When we scanned the same grid twice within 48 hours, 4% of points changed rank and almost none moved by three places or more, so a single scan is a reliable picture as long as you compare like with like.
Is Google Maps ranking the same as the local pack ranking?
They are close but not identical. The local pack is the box of three businesses inside the normal Google search results. Google Maps is the separate map app and website, where the list is longer. The same signals drive both, so a business ranking first on Maps from a spot is very likely in the local pack there too, but the order is not always the same. Grid trackers usually measure Google Maps.
Can I track a competitor's Google Maps rankings?
Yes. Rankings are public, so you can scan any business by its name or its Google Maps link without connecting a Google account. Every scan also records the top 20 businesses at every point, which shows you which competitors hold which part of the map without scanning them separately.
Is there a free local rank tracker?
Yes. You can run a free 25-point scan for any business on our Google Maps rank tracker page with no account and no card. A free account adds 250 Grid Credits, which is about five scans at 7 by 7. Paid packages include 5,000 to 45,000 Grid Credits a month and scheduled scans.